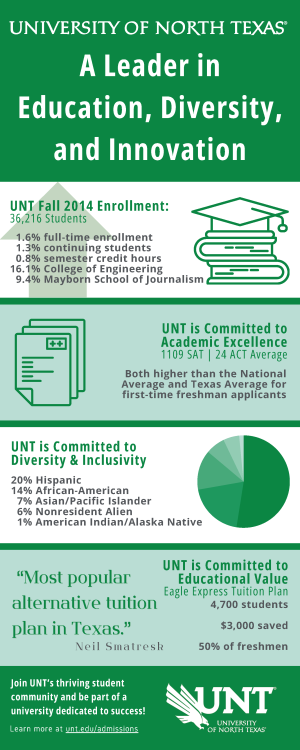
This artifact features an infographic designed to convey complex information in an accessible and visually engaging format. Created as part of a design course, the project focused on applying visual communication principles and leveraging Canva to produce a professional-quality deliverable.
Goals
The goals of the project included:
- simplifying complex data into a clear and engaging visual format
- applying design principles to create an infographic that is both informative and appealing
- leveraging Canva’s tools and templates to produce a professional-quality visual
Objectives
The primary objectives of this project were to:
- develop a cohesive design that aligns with the target audience’s needs and preferences
- apply principles of contrast, balance, and alignment to enhance readability
- develop a cohesive design that aligns with the target audience’s needs and preferences
Outcome
The project achieved the following results:
Professional Infographic
A polished, single-page visual created for both print and digital use.
Readable Design
Enhanced clarity and comprehension through strategic application of visual hierarchy.
Applied Proficiency
Demonstrated skill in Canva and mastery of core infographic design principles.
Approach
The project began with selecting a dataset and analyzing its key points to determine the most important information to highlight.
Using Canva, I applied design elements such as icons, charts, and typography to structure the content effectively.
The layout was developed with a focus on visual hierarchy, ensuring that the most critical information stood out.
Feedback from peers helped refine the design, resulting in a polished final product suitable for both print and digital distribution.
Final Deliverable
The final deliverable is a high-resolution infographic, submitted as both a high-resolution PNG and high-resolution PDF export for print and web formats.